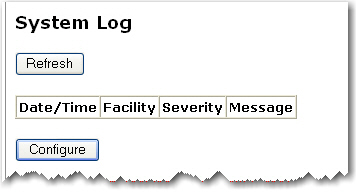
This log displays TCP/UDP LAN and WAN interface traffic which is destined for the gateway. This can help you detect if any unauthorised users are attempting to access your network.
The Refresh button will update the log to show the most recent information.
The Configure button is for specifying what type of data you want to display in the log:
Click Configure to display the following page:
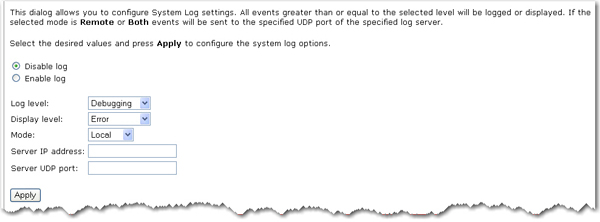
Select your options for logging and displaying the log: Disable log / Enable log
Select your Log level. The Log Level allows you to configure which types of events are logged. There are several levels of log events that are displayed differently:
Emergency = system is unusable (these appear in red in the log)
Alert = action must be taken immediately (pale red)
Critical = critical conditions (orange)
Error = error conditions (yellow)
Warning = warning conditions (green)
Notice = normal but significant conditions (blue)
Informational = information events (white)
Debugging = debug-level messages (dark grey on cream)
The gateway records all log events at the chosen level and above. For instance, if you set the log level to Critical, all critical, alert, and emergency events are logged, but none of the others are recorded.
Select the Display level for the log. This lets you choose the event level to display in the previous System Log page. This item uses the same event level ranking as Log Level above, but it applies to what events are displayed in the WUI rather than recorded.
Select the Mode for the log, stored in the gateway's local memory, be sent to a remote log server, or both simultaneously. If you choose Remote, the system log will not show the events saved on the remote server. The remote server would be a syslog device, which you would need to set up.
Enter the Server IP address of the remote log server.
Enter the Server UDP port of the remote log server. By convention, port number 514 is often used, but you can enter any port number you like.
Click Apply to save your settings and view the log with the new settings.
Return to the Status menu options.